David Fields — Data Vizzer

I turn how people actually behave into data stories that change decisions.

Most technology helps companies broadcast. I work on the part that helps them listen: analytics, experimentation and visualization that show what audiences really do, then make the case so clearly that the decision makes itself.

10+ years in analytics75+ data stories shippedEvidence over opinions
David Fieldshi, I'm David · Alexandria, VA
Latest work — September 2026

Arlington vs. Washington, D.C.

Arlington has been named America's fittest city nine years running. I pulled nine editions of the ranking apart to see what the title is actually measuring — and found that the city across the river beats it on almost every measure of people actually exercising.

Data story · Public health

Across the Potomac

The ACSM Fitness Index publishes no dataset, so I recovered all 100 cities and 42 indicators from the widget behind its comparison tool — then found two of its own editions were wrong. D.C. does the exercising; Arlington gets the health; the title goes to the second thing.

100 cities × 42 indicators9 editionsPythonData forensics
Read the story

2026 · value and rank of 100

IndicatorArlingtonWashington
Meets aerobic + strength 33.4%22nd 38.3%3rd
Bikes or walks to work 5.4%26th 14.7%2nd
Smoking rate 1.2%1st 8.5%36th
Diabetes rate 5.7%1st 8.4%14th
D.C. leads 6 of 9 health behaviours. Arlington leads 9 of 10 health outcomes.
Latest work — three pieces from one race

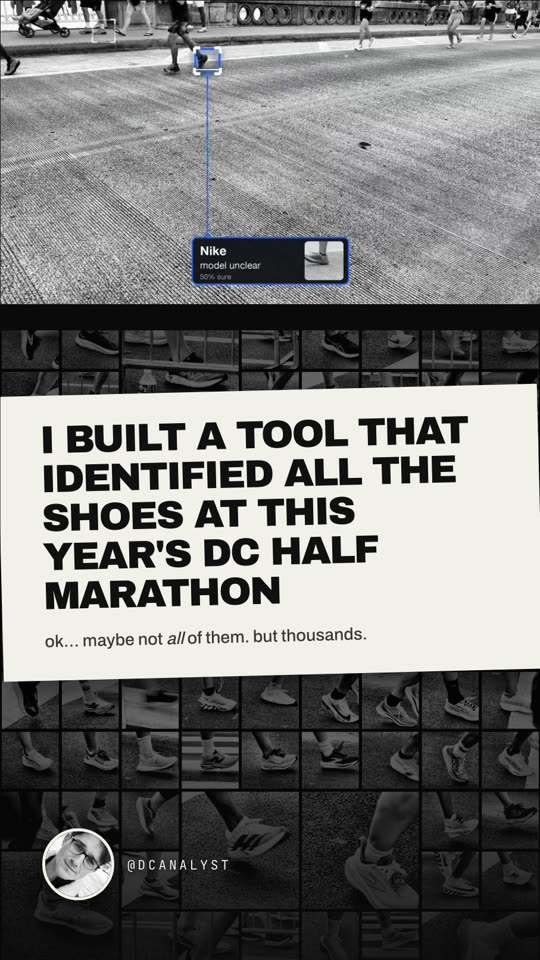
The DC Half Marathon, decoded

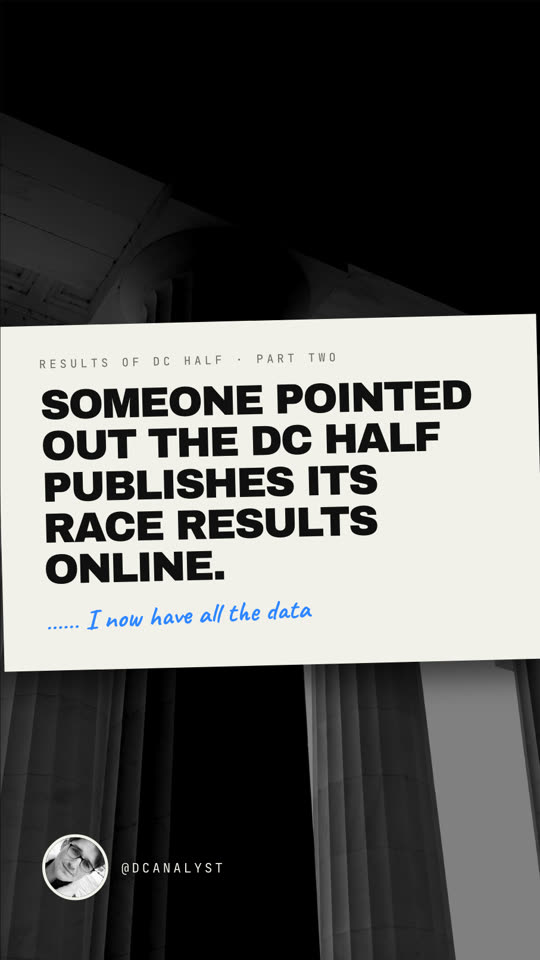
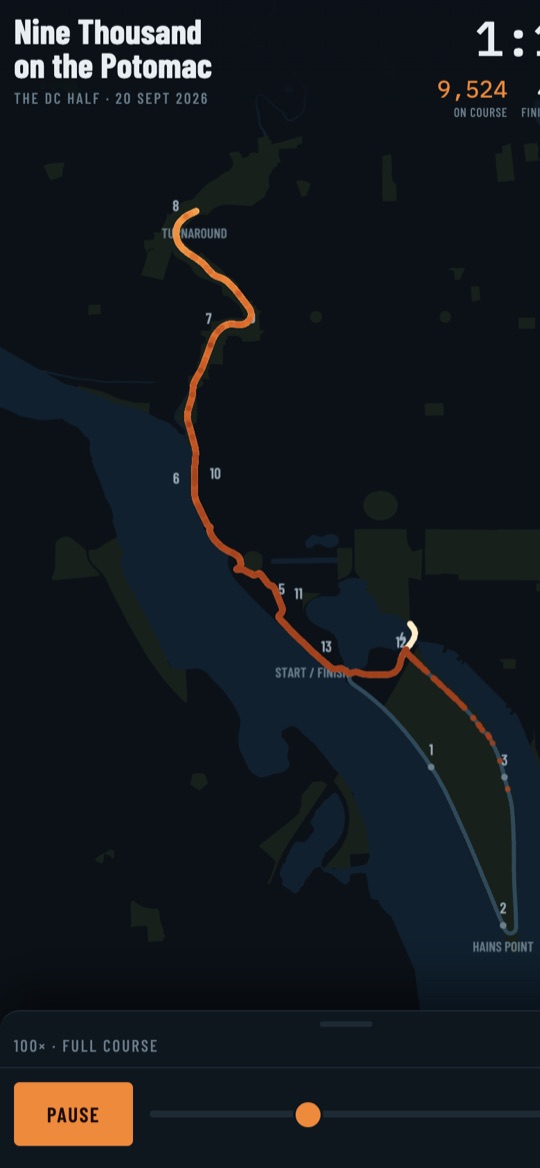
I filmed the race from the sidewalk, built a computer-vision pipeline that identified thousands of shoes, pulled the results data apart, then rebuilt the whole race as a replay. Open them on your phone.

The first two are Instagram-style stories: swipe on a phone, arrow keys or scroll on a desktop. The replay is a live map: press play and scrub.

About

Profit through purpose

I believe the best companies create profit through purpose. As a champion of the scientific method and user advocacy, I help organizations make decisions based on evidence, not opinions.

My mission is simple: help companies decode how their audiences interact with digital experiences, then transform that insight into compelling data stories that drive real business impact.

"Ideas are powerful. Opinions are dangerous. Everyone needs to show the data."

David Fields at his deskat the desk
How I approach every project
User-centered design

Users ignore systems that ignore users. I use data to understand and serve them better.

Data-driven decisions

Proven frameworks, rigorous measurement, and the discipline to let the evidence win the argument.

Innovation

Combining usefulness and novelty to create new solutions through design sprints.

Continuous learning

Failing fast, failing small and failing forward to drive continuous improvement.

Technical skills

The toolkit

Built through years of hands-on work, from tagging and pipelines to the final chart.

Years of hands-on use
AnalyticsGoogle Analytics · Tableau
8+ yrs
Data engineeringSQL · Python · BigQuery
7+ yrs
VisualizationPower BI · Looker · R
9+ yrs
Quantitative & qualitative methods
8 yrs · 45+ projects

Statistical rigor plus human insight, bridging numbers and narratives.

Market researchUser behaviorPerformance metricsContent strategy
Design thinking
6 yrs · 32+ projects

Human-centered innovation that integrates user needs with technical feasibility.

Product developmentUXProcess improvementStrategic planning
A/B & multivariate testing
7 yrs · 60+ projects

Systematic experimentation to optimize experiences and conversion.

Conversion optimizationMarketing campaignsProduct features
Data visualization
9 yrs · 75+ projects

Complex data into visual narratives that drive decisions and communicate clearly.

Executive dashboardsPerformance reportsData storiesInteractive analytics
Organizations I've had the privilege to work with

Notable clients

Meaningful projects across very different organizations, all with the same goal: better decisions through data.

National AquariumEducation & conservation
VolkswagenAutomotive
American Red CrossNon-profit
The White HouseGovernment
Peace CorpsInternational development
KawasakiMotorcycle
Professional experience

Career journey

Over a decade in data, from grassroots community development to enterprise analytics.

Mar 2025 — present · Alexandria, VA

Data Vizzer

Arkatechture

Leading data visualization initiatives and developing solutions for client data challenges.

  • Developing cutting-edge data visualization solutions
  • Leading strategic data initiatives
  • Collaborating with cross-functional teams
Data visualizationStrategic planningClient relations
Mar 2020 — Feb 2025 · Alexandria, VA

Sr. Data Analyst

HZ

Advanced analytics focused on digital performance optimization and strategic data insights.

  • Developed comprehensive reporting frameworks
  • Led data-driven strategy initiatives
  • Mentored junior analysts
Advanced analyticsTeam leadershipStrategy development
Mar 2014 — 2020 · Washington, DC

Analyst & Special Projects Coordinator

National Peace Corps Association

Identified early-stage opportunities with high potential for building and engaging the Peace Corps community, reporting directly to the NPCA President.

  • Developed data-driven strategies and materials across departments
  • Established "for-purpose" collaboration between emerging markets
  • Led a human-centered design approach to development
Strategic planningCommunity engagementProject coordination
Mar 2011 — Mar 2013 · Twifo Praso, Ghana

Volunteer

Peace Corps

27 months expanding the piped-water network in Twifo Praso district in the central region of Ghana.

  • Organized Better Business community groups
  • Introduced a low-tech audience response system to improve tracking
  • Expanded water infrastructure in rural communities
Community developmentProject managementCultural adaptation
Education & learning

Academic foundation

A science degree, then a decade of continuous learning in analytics and design.

B.S. Biology
Marshall University · 2003–2008 · Huntington, WV
  • Strong foundation in the scientific method
  • Research and analytical thinking
  • Laboratory data collection and statistical analysis
Agriculture studies
West Virginia University · 2009–2010 · Morgantown, WV
  • Sustainable development principles
  • Systems thinking
  • Environmental impact and community-based development
Continuing education
Ongoing
  • Data science & machine learning: Python, statistical learning, predictive analytics
  • UX & design: human-centered design, design thinking, user research, prototyping
  • Business intelligence: analytics strategy, KPI development, dashboard design
Professional certifications
Google Analytics CertifiedGoogle Ads CertifiedTableau Desktop SpecialistPower BI Data AnalystAdvanced Statistical AnalysisDesign Sprint Facilitation
Work with me

Let's make the case with data

Dashboards, analytics, experiments or a data story like the ones above. Tell me what you're trying to decide and I'll reply with how I'd approach it.

Email
David@dcanalyst.com
Phone
202.602.9444
Location
Alexandria, VA · remote-friendly
Reply time
Within 24 hours for a first response; 3–5 days for a detailed proposal.